After more than 13 years, and tens of thousands of questions, Moz Q&A closed on 12th December 2024. Whilst we’re not completely removing the content - many posts will still be possible to view - we have locked both new posts and new replies. More details here.
Google Trends Data Weird Since 1/1/2022
-
I am finding several instances of weird data drop offs on Google Trends at 1/1/2022. It seems like it's for data associated with a type/category as opposed to a search term. Here are some examples of "search interest" dropping suddenly off to next-to-nothing for prominent brands.
- Patagonia / clothing company
- Lands' End / clothing company
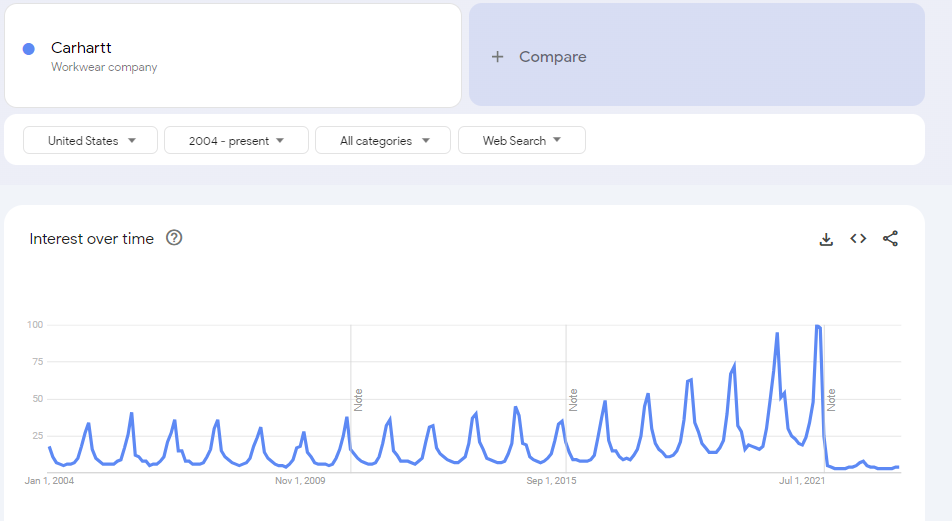
- Carhartt / workwear company
Example screenshot.
Does anyone know what the cause of this is? Has Google stated anything directly about why the data suddenly changed so significantly?
-
Google Trends data can appear strange due to seasonal patterns, news events, geographic variations, data sampling, facebook ads cloaking spelling differences, data lag, and other factors. Interpreting this data requires considering these aspects and analyzing it in the context of your research.
-
@LivDetrick Yes - you are pointing toward is important to notice - it can be a data glitch from google, but there is an event that is "Corona", that might make them to shift there strategy work around, like shifting the traffic from web to app or might be people preference of search have changed......
Until we do not study each business in detail its difficult to say.
Warm Regards
Rahul Gupta -
Google Trends data may appear unusual since January 1, 2022, due to various factors, including data anomalies, seasonal trends, algorithm updates, local influences, privacy measures, and changes in user behavior. To better understand these changes, check the date range, compare different search terms, and consider external events. If the issue persists, consult Google's official resources for updates and explanations.
-
@Suvidit-Academy thanks for the response, however, it seems terribly unlikely that these brands all had a legitimate massive fall off in search interest all on the exact same date...
-
Hello. Sometimes I get bored, but I know a game that will help me have fun. I visited the website https://linkaviator.com/lucky-jet/. This site offers a large list of casinos with the Aviator game. The biggest advantage of this site is that it contains information to help you get started playing the game, as well as casinos that have reviews and feedback from real users."
-
-
The drop-off in Google Trends data for prominent brands like Patagonia, Lands' End, and Carhartt on 1/1/2022 may be due to various factors, including potential changes in how Google collects and presents data, privacy policy updates, or fluctuations in search interest for those brands. It's essential to consider that Google Trends data can have occasional anomalies or inconsistencies, and it's advisable to cross-reference this data with other sources for a comprehensive analysis.
(PMP Exam Prep) (Project management courses) (Canada PR) (Study abroad)
-
The unusual data drop-offs on Google Trends around January 1, 2022, appear to affect not specific search terms but broader categories or types, as demonstrated by the sudden decline in "search interest" for prominent brands like Patagonia, Lands' End, and Carhartt. There may be various reasons for this phenomenon, such as changes in Google's algorithms or data collection methods. However, as of my last knowledge update in September 2021, Google had not publicly disclosed any specific reasons for such abrupt data changes. To get more accurate and up-to-date information, it would be advisable to check Google's official statements or contact their support.
(Canada PR) (Study abroad)(PMP Exam Prep)( list of documents required for Canada PR from India) -
Its a very nice observation, but to unearth the real reason need to understand that why people are searching for them like
- Carhartt is facing online boycott.
- Lands' End is struggling online, (https://www.digitalcommerce360.com/article/lands-end-ecommerce/), the article suggest that they are more focusing on Apps (might be connecting to the target audience directly on app).
- Patagonia - People are rating the company poorly (https://www.trustpilot.com/review/www.patagonia.com)
So here is a small input from the quick google search that there is something people are not comfortable with these companies.
Warm Regards
Rahul Gupta
Suvidit Academy -
The significant drop-offs in search interest for prominent brands like Patagonia, Lands' End, and Carhartt on Google Trends starting from 1/1/2022 could be attributed to various factors, such as changes in user behavior, adjustments in how Google collects and reports data, or even seasonal variations. Google may not have explicitly stated the cause for these changes. It's possible that these shifts in data could be due to fluctuations in public interest or how Google processes and presents trend data. To get a clearer understanding of these changes, it would be advisable to reach out to Google's support or explore their documentation for any relevant updates.
.
.
(Study abroad) (Canada PR) (PMP Exam Prep) (Colleges In Brampton Canada For International Students)
Got a burning SEO question?
Subscribe to Moz Pro to gain full access to Q&A, answer questions, and ask your own.
Explore more categories
-
Chat with the community about the Moz tools.
-
Discuss the SEO process with fellow marketers
-
Discuss industry events, jobs, and news!
-
Chat about tactics outside of SEO
-
Dive into research and trends in the search industry.
-
Support
Connect on product support and feature requests.
-